Turning a Technical SEO Audit into a Strategic Action Plan

A case study in prioritising website optimisation using crawl, analytics and search performance data
The challenge
A client approached me following a routine technical SEO audit which had produced a familiar outcome: hundreds of warnings across their website.
The crawl report highlighted issues such as title tags that were outside recommended lengths, inconsistent or missing meta descriptions, duplicate or missing H1 headings and other structural inconsistencies. None of these findings were unusual. Modern SEO crawling tools are designed to surface anything that does not align with best practice guidelines.
The difficulty, however, is that these tools treat every issue equally. A crawler cannot distinguish between a technical issue on a page that receives thousands of visits each month and the same issue on a page that almost nobody ever sees.
For the client, this created a practical problem. The audit had surfaced a large volume of technical warnings, but it did not clearly show where optimisation work should begin. The objective therefore became to convert a long list of crawl warnings into a prioritised action plan that focused attention on the pages where improvements would deliver the greatest impact.
Bringing the data together
To move beyond the limitations of the crawl report, three different sources of data were combined.
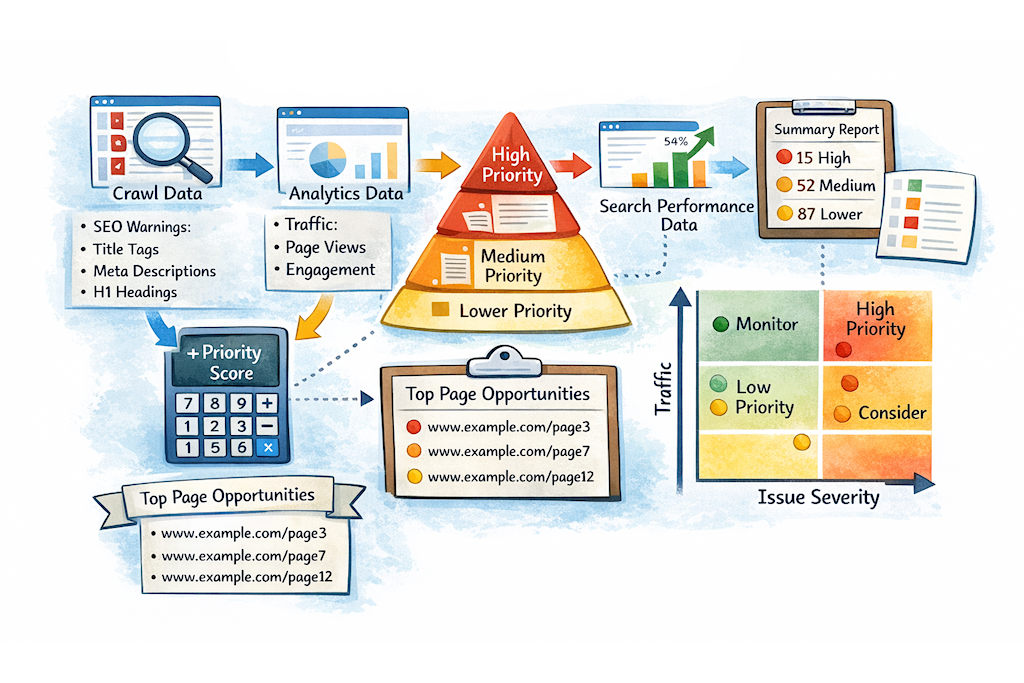
The starting point was the crawl data itself. This provided the technical view of the site, capturing structural information for each page such as title length, meta description length, heading structure and the total number of issues detected. This dataset revealed where technical SEO standards were not being met.
However, technical information alone does not indicate which pages are commercially important. To understand how visitors actually interact with the site, a second dataset was exported from Google Analytics. This added behavioural metrics such as page views, active users and engagement signals. In other words, it revealed which pages people were actually using.
A third dataset was then introduced from Google Search Console. While analytics tells us how users behave once they arrive on a website, Search Console reveals how the site performs directly within Google search results. Metrics such as impressions, clicks, click-through rate and average search position show how often a page appears in search results and whether users choose to click on it.
Taken together, these three sources of information provided a much richer picture of the site. The crawl data showed technical quality, analytics revealed user behaviour, and Search Console exposed search visibility and click performance.
Because these tools report data in slightly different formats, the datasets first had to be normalised. The crawler outputs full URLs, while analytics typically reports page paths. To align the data, full page URLs were reconstructed from the analytics exports and matched against the crawl dataset. Search Console data was then mapped to the same URLs.
Once combined, each page in the dataset contained three perspectives at once: its technical SEO structure, its real-world traffic and engagement, and its performance within search results.
Preparing the dataset
Before any meaningful analysis could take place, the data required some cleaning.
One important step was removing tracking parameters from URLs. Marketing platforms frequently append UTM parameters to links, which can cause the same page to appear multiple times in datasets even though it is technically the same URL. By stripping everything after the query string, each page could be treated as a single canonical entry.
Duplicate URLs were then consolidated so that every row in the dataset represented a unique page. At this point the analysis table effectively became a master list of site pages, enriched with technical signals, behavioural metrics and search performance data.
With the data structured in this way, it became possible to build a prioritisation model.
Creating a prioritisation framework
The next step was to translate the data into a scoring model that could rank pages objectively.
The first component of the model was an issue severity score. Technical issues were categorised according to their likely importance. Missing or duplicate H1 headings were considered higher severity issues because they can affect page structure and relevance signals. Title tags that were too long or too short were treated as moderate issues, while meta description length inconsistencies were given a lower weighting.
Each page therefore accumulated a score based on the technical issues identified during the crawl.
The second component of the model introduced a traffic weighting. Pages that attract large numbers of visitors are inherently more important because improvements on those pages are more likely to influence search visibility, user engagement and ultimately conversions. Traffic tiers were therefore used to assign higher weights to pages receiving greater volumes of visits.
Search Console data added a third perspective by highlighting pages where search visibility existed but performance could potentially be improved. For example, a page that appears frequently in search results but receives relatively few clicks may indicate that its title or description is not compelling enough. These pages often represent valuable optimisation opportunities.
Calculating the priority score
With these inputs in place, a simple formula was used to generate a priority score for every page.
Priority Score = Traffic Weight × Issue Severity
This approach ensures that pages with both high traffic and significant technical issues rise naturally to the top of the list, while pages with minimal traffic fall further down the priority order.
Search Console data was then used as an additional signal to identify pages where improvements to titles or descriptions might increase click-through rates.
To make the output easy to interpret, the scores were grouped into three clear priority bands. Pages receiving the highest scores were marked red, indicating immediate action. Pages with moderate scores were classified as amber, highlighting worthwhile optimisation opportunities. Lower-scoring pages were labelled yellow to indicate that they were lower priority or largely cosmetic improvements.
This process transformed a large, technically complex dataset into a clear and structured action plan.
Producing the outputs
Once the prioritisation model had been applied, several practical outputs were generated.
The first was a concise list of the top optimisation opportunities across the site. By focusing on the highest-scoring pages, the client could immediately see where technical improvements were most likely to deliver measurable results.
Alongside this, a full page-level dataset was retained as a reference document. This allowed deeper investigation where necessary and ensured that the entire site remained visible within the analysis.
A summary view was also created to show how many high, medium and low priority issues existed across the site. This made it easier to identify pages that contained clusters of structural issues and might benefit from broader optimisation work.
Finally, the pages were mapped onto a simple four-quadrant matrix that compared traffic levels with issue severity. This visual framework made it immediately clear where effort should be focused: high-traffic pages with significant issues became the highest priority, while low-traffic pages with minimal problems could safely be deprioritised.
The outcome
By combining crawl data with analytics and search performance data, the project shifted from a technical problem list to a strategic optimisation plan.
Instead of attempting to correct hundreds of warnings across the entire website, the client could now focus on the pages where improvements were most likely to influence search visibility, click-through rates and user engagement.
In practical terms, the approach replaced an overwhelming technical audit with a clear roadmap for optimisation. Time and resources could be directed towards the areas most likely to deliver measurable returns, ensuring that SEO improvements were both efficient and commercially meaningful.